Here are today's results:
| Tipster: | P/L Today: | Stakes: | ROI: | Missed: | P/L 30 Days: |
| 4PA | 0.00 | 0.00 | 0% | 0.00 | 13.15 |
| CL | 0.00 | 0.00 | 0% | 0.00 | 0.00 |
| EI | 0.00 | 0.00 | 0% | 0.00 | 1.33 |
| FE | 0.00 | 0.00 | 0% | 0.00 | 2.78 |
| FI | 0.00 | 0.00 | 0% | 0.00 | 0.00 |
| MGB | 0.00 | 0.00 | 0% | 0.00 | -1.00 |
| OTO | 0.00 | 0.00 | 0% | 0.00 | 0.00 |
| PB | -0.47 | 1.00 | -47% | 0.00 | 3.78 |
| SK | 0.00 | 0.00 | 0% | 0.00 | -3.73 |
| CNB | 0.00 | 0.00 | 0% | 0.00 | -0.48 |
| FES | 0.00 | 0.00 | 0% | 0.00 | -1.61 |
| EWV | -1.00 | 2.00 | -100% | 0.00 | -26.22 |
| AB | 0.00 | 0.00 | 0% | 0.00 | -4.13 |
| MB | 0.00 | 0.00 | 0% | 0.00 | 0.61 |
| SPDT | 0.00 | 0.00 | 0% | 0.00 | 1.77 |
| -1.47 | 3.00 | -10% | 0.00 | -13.75 |
Again, nothing much happening. Pro Bandit got close again and Each Way Value had a loser and a non-runner.
I recently changed my staking for Each Way Value and do feel a little hard done by. The reason being is that I vehemently stuck to the 11/1 rule. Now, during the first week there were a few winners and I couldn't get on any of them either because by the time I had got to the computer the odds had shortened or because BF SP was below the 11/1. After reading the SBC forum it became clear that not everyone followed the rule and there was some degree of flexibility. What I'm annoyed about is that since I've been flexible and lowered my minimum odds for the service to 7/1 there have been no winners but greater than 11/1 has been easily available for most of the tips. Anyway, it just goes to show how you can get caught out and end up -26.22PTS in the red with a service. There have been many a times when I've caught a service when it's been on the up so I can't complain.
Here is August's graph:
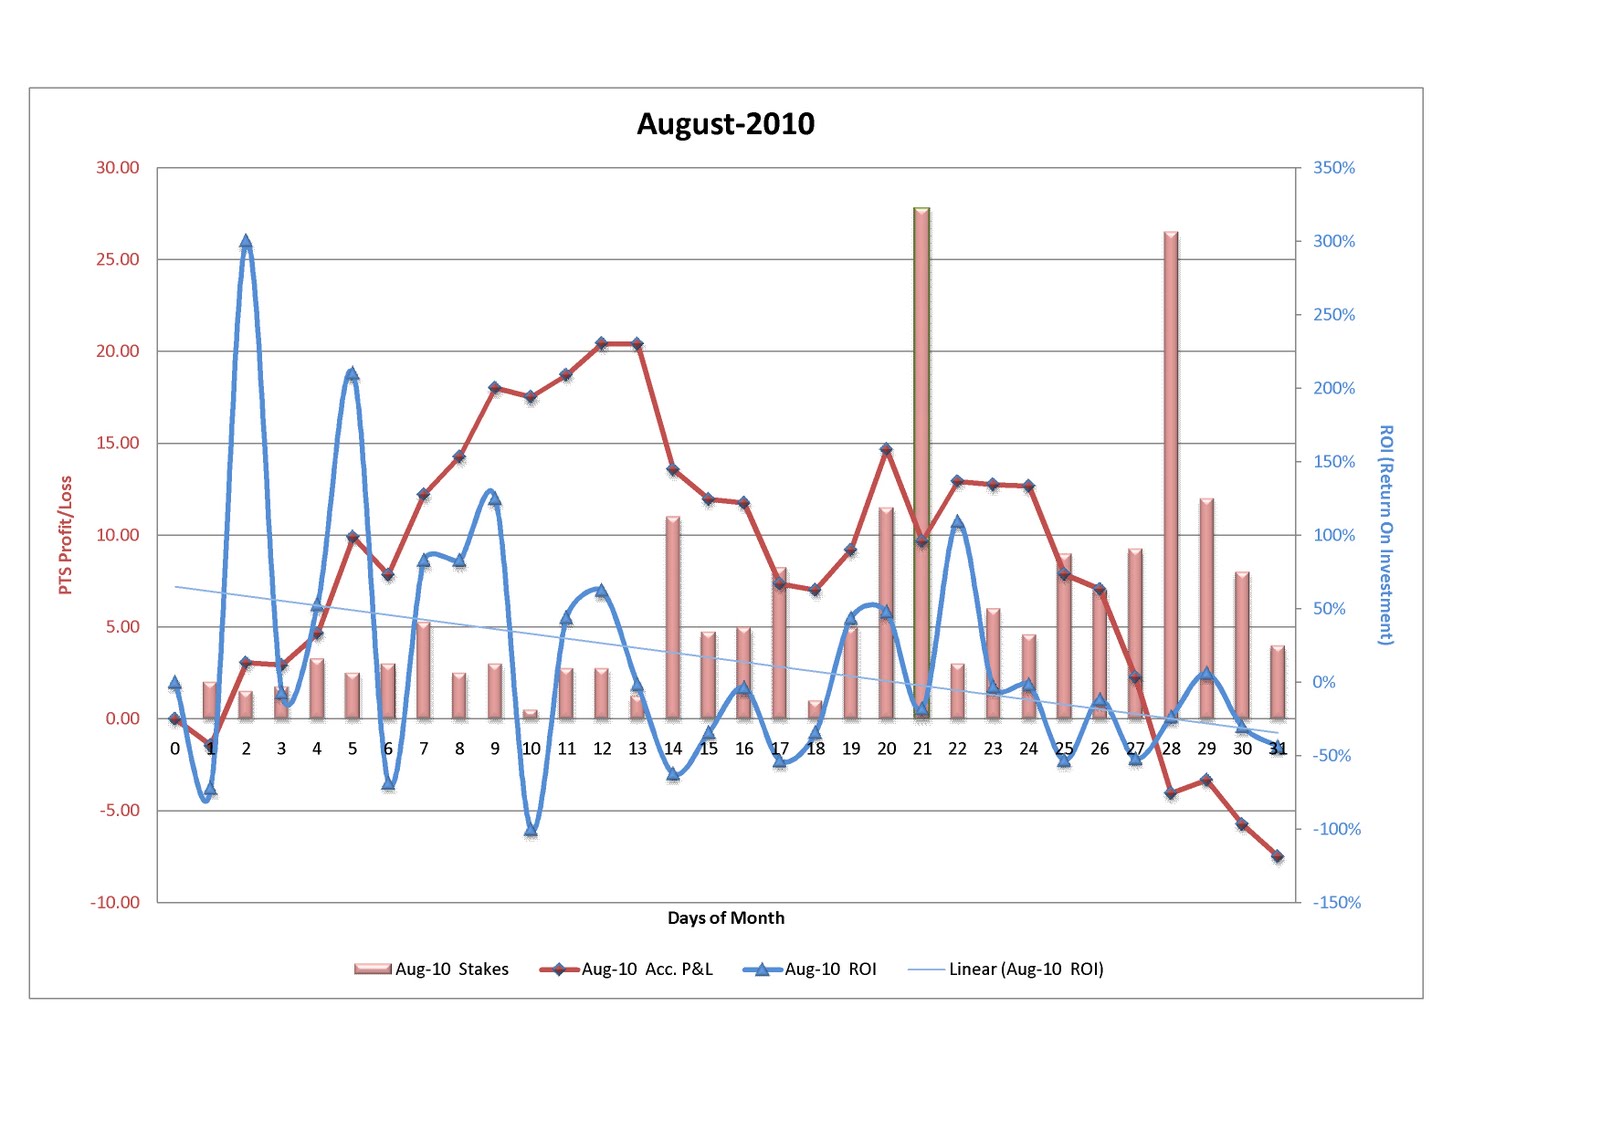
It may seem a little confusing at first but it is quite simple, all information is in points:
- The bar graph refers to daily Stakes - the taller the bar the higher the stakes for that given day;
- The dark red line refers to Accumulated Profit/Loss over the course of the month. If it finishes above 0 there was a profit, if below 0 there was a loss;
- The thick blue line refers to Return On Investment on a daily basis - use the y axis on the right;
- The straight blue line refers to the Average Return On Investment - if the line is ascending the Average ROI increased during the month.
I do have some other graphs but I'll include them at another time, each with an explanation. All I need now is for the graphs to start looking good, results wise! lol
A good result for England tonight, I think Jamie Redknapp got it wrong when he said that Fabio Capello would be happy to walk away with a draw. From what I've seen since the Germany game the players appear to want to put things right and the young players are certainly making their marks. And, I think Capello wants another good set of qualifying results.
Until tomorrow!
No comments:
Post a Comment